I recently discovered a strange performance issue in a popular statistics library that makes it possible to speed up fitting an ARIMA model by a factor of four, just by adding one line of code, and without changing how the model is fit.
Here's how I discovered it.
Motivation
Recently, I was working on a project which required me to fit ARIMA models to over ten thousand time series using the Python package pmdarima. This is a handy Python package which automates the selection of ARIMA models by varying the p, d, and q parameters, and measuring model fit for each one, while penalizing more complex models.
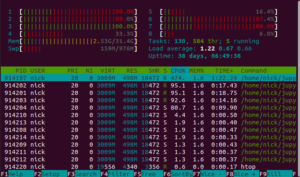
Unfortunately, fitting these models is very slow, so I started looking for a way to parallelize it. When I started this work, I ran into something surprising: it's already using multiple cores!

This contradicts the pmdarima documentation. The documentation says that parallelism is only used when doing a grid search. However, I'm using the stepwise algorithm for fitting the model, which is supposedly not parallelized.
As I'll show later in this blog post, although it's running in parallel, it's not doing anything useful with those extra cores.
Dataset
In order to demonstrate this issue, I'm using a time-series dataset for grocery stores in Ecuador. The way I'm going to frame this problem is to consider each store and category of items separately, and fit an ARIMA model to each one.
Measuring performance
Most Python benchmarking only tools measure elapsed time, but to debug this issue I needed a way to measure both wall-clock time and CPU time. (Wall-clock time is another name for elapsed time. CPU time is wall-clock time multiplied by the average number of cores that were used.)
I wrote a context manager which measures both kinds of time - the full details are in the notebook at the end of the post. The sections marked with with MyTimer() as timer: are being timed this way.
How parallel is auto_arima?
I wrote a test which uses a package called threadpoolctl to restrict parallelism. I tested fitting the model with and without restricting parallelism.
for limit_cores in [True, False]:
    series = array[0, 0]
    with MyTimer() as timer:
        if limit_cores:
            controller = ThreadpoolController()
            with controller.limit(limits=1, user_api='blas'):
                fit = pm.auto_arima(series)
        else:
            fit = pm.auto_arima(series)
    print(f"lim: {limit_cores} wall: {timer.wall_time:.3f} cpu: {timer.cpu_time:.3f} ")
Here are the results of this test:
lim: True wall: 8.006 cpu: 8.539
lim: False wall: 8.312 cpu: 33.715
There are several things we can learn from the output here:
- When limiting the parallelism, the wall-clock time is roughly equal to the CPU time.
- When not limiting the parallelism, the CPU time is about eight times larger than the wall clock time, so something is using every core, even if the pmdarima documentation says otherwise.
- The multicore version takes longer to run than the singlecore version. That's pretty surprising - I would expect the multicore version to be faster.
- The multicore version falls even further behind in CPU time: although it slightly slower in elapsed time, it is 3.9x slower in CPU time.
Slowdown cause
Why does pmdarima slow down when you give it additional cores?
I'm not exactly sure what causes the slowdown here. My rough theory is that pmdarima uses statsmodels internally, which uses scipy internally, which uses numpy internally, which uses OpenBLAS internally.
OpenBLAS is a linear algebra library which provides various matrix and vector operations, and can use multiple threads to process a large matrix operation. However, for some small operations, the overhead associated with giving work to a different thread will be larger than the gain from parallelism.
I'm guessing that the threshold for where it switches from a singlecore operation to a multicore operation is set too low, and that's why restricting the parallelism makes it faster.
As evidence for this, note that with controller.limit(limits=1, user_api='blas'): restricts parallelism, but only for libraries that implement the BLAS api.
Adding parallelism back in
My original purpose for looking into this was that I needed to fit over ten thousand ARIMA models to different time series. Rather than trying to parallelize within a single ARIMA model, I can run multiple different ARIMA models in parallel. This is more efficient, because the units of work are larger.
I set up a very similar problem, except that instead of fitting a single model, it fits one model for each category in a certain store. It uses multiprocessing to distribute each time series to a different process. (You cannot use ThreadPool here because auto_arima() holds the GIL most of the time.)
For the first test, I put no limit on parallelism, so within each ARIMA model, the calculation is also parallelized. For the second test, each process is limited to a single thread.
controller = ThreadpoolController()

def attach_limit(func, limit, *args, **kwargs):
    """Call func() using a limited number of cores, or no limit if limit is None."""
    if limit:
        return func(*args, **kwargs)
    else:
        with controller.limit(limits=1, user_api='blas'):
            return func(*args, **kwargs)

def predict(x):
    return pm.auto_arima(x, error_action="ignore")

for limit in [True, False]:
    with multiprocessing.Pool() as p:
        # Get one store
        store_array = array[1]
        with MyTimer() as timer:
            predict_restrict = functools.partial(attach_limit, predict, limit)
            p.map(predict_restrict, store_array)
        print(f"lim: {str(limit).ljust(4)} time: {timer.wall_time:.3f}")
Result:
lim: True time: 144.185
lim: False time: 534.951
The result of this is a 3.7x speedup for disabling BLAS parallelism, with no changes to how the model is fit. (This is on a 4 core computer - you may get different numbers on a computer with more or less cores.)
Notebook
A jupyter notebook demonstrating this technique can be downloaded here.
Summary
- OpenBLAS does some things in parallel even if you don't ask for it.
- You can turn this behavior off with the threadpoolctl library.
- Turning it off results in a 1.8x speedup, or a 3.7x speedup if you're also fitting multiple ARIMA models.
